Supply Chain Analytics
Inventory Optimization Dashboard
A supply chain analytics project focused on reducing inventory holding costs, improving service levels, and enabling data-driven replenishment decisions through interactive dashboards and demand analysis.

Field Study
Vol. 05
Reducing Inventory Cost without increasing stockout risk.
18%Holding cost reduction
Fig. 1 — Regional fulfillment center
Project at a GlanceAn executive
An executive
briefing.
Executive Snapshot
Excess safety stock had quietly locked up $2.4M in working capital while stockouts persisted on fast-moving lines. A demand-driven reorder model rebalanced inventory across 40 SKUs — cutting holding cost 18% while lifting service levels to 98.5%.
18%
Holding Cost Reduction
98.5%
Service Level
40
SKUs Optimized
$2.4M
Inventory Value Managed
Key Information
- Industry
- FMCG
- Business Domain
- Supply Chain
- Company Size
- 1,200+ Employees.
- Role
- Data Analyst
- Project Duration
- 1 Weeks
- Project Type
- Dummy Project
- Status
- Completed
Business Goal
- 01Reduce inventory holding cost
- 02Maintain target service levels
- 03Improve demand forecasting accuracy
Deliverables & Methods
SQLExcelTableauDemand Forecasting
Chapter 01 · The Investigation.Why this project
Why this project
mattered.
For two years, the business had been buying against uncertainty. Every planner made replenishment decisions independently, causing inventory levels to grow without improving product availability.
Capital became trapped in slow-moving inventory while high-demand products frequently experienced stockouts. The organization lacked a unified view of inventory performance, making it difficult to balance service levels with inventory costs.
Without a data-driven replenishment strategy, excess inventory and missed sales continued to increase operational inefficiencies.
Business Question
Why this project mattered.
Hypotheses
- H1Safety stock is set too high for slow-moving SKUs.
- H2Reorder points are not driven by actual demand.
Evidence Required
Historical demandInventory levelSales trend
The Case File
Exhibits A–C Exhibit A
Warehouse Observation
Wk 02Photo
Surplus safety stock accumulating in high-value aisles.
“We add a buffer when we’re unsure.” “No shared number for lead time.” “Reviews happen monthly, not weekly.”
Planner Interviews
Wk 03Meeting Notes
Each planner hedged demand independently.
AvgMax
Northvale9d21d
Cortez Co12d19d
Halden6d14d
Supplier Lead-Time Log
Wk 04Records
Lead times varied far more than policy assumed.
““Every recommendation in this project is supported by documented evidence.””
Chapter 02 · Process
From Raw Data to Actionable Insights
A structured workflow was used to transform raw inventory and sales data into a reliable analytical foundation for identifying stock patterns, demand behavior, and optimization opportunities.
Define the Business Objective
Identify the key inventory challenges and establish the questions the analysis needs to answer, focusing on stock availability, demand patterns, and the risk of overstocking or stockouts.
Collect & Consolidate Data
Gather the relevant inventory, product, sales, and operational data into a consistent structure so different data points can be analyzed together.
Clean & Validate
Check data quality by handling missing values, duplicates, inconsistent formats, and invalid records before using the dataset for further analysis.
Transform & Prepare
Standardize fields, organize product-level records, and derive the metrics required to evaluate inventory movement, demand trends, and stock performance.
Analyze Inventory Patterns
Examine demand behavior, product performance, stock movement, and potential inventory imbalances to identify patterns that require deeper investigation.
Build & Validate the Dashboard
Translate the prepared data into an interactive dashboard, then validate the calculations and visual outputs against the underlying dataset to ensure the insights remain reliable.
Chapter 03 · The Analysis
Analysis & findings.
Major Findings
Service levels remained stable after optimization — the trade-off was largely illusory.
Lead-time assumptions underestimated real operational variability by a wide margin.
Supporting Visual Evidence
Monthly inventory holding cost
Exhibit G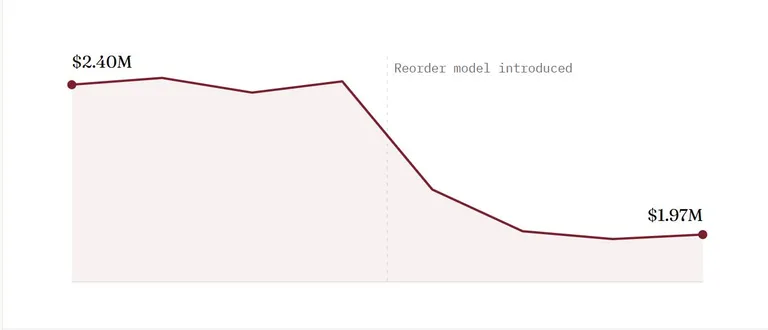
Technical Evidence
The tools changed. The reasoning did not.
SegmentationSQL
SELECT sku,AVG(weekly_units) AS mean_demand,STDDEV(weekly_units) AS demand_sd,SUM(on_hand_value) AS held_valueFROM inventory_weeklyGROUP BY skuHAVING demand_sd / mean_demand > 0.6 -- volatileORDER BY held_value DESC;
Chapter 04 · The Decision
Recommendations.
Priority 01
Set reorder points from live demand.
Replace static safety-stock rules with a service-level formula driven by measured demand variability and lead time.
Priority 02
Right-size slow-moving SKUs.
Draw down excess safety stock on the low-velocity lines that held the majority of trapped working capital.
Priority 03
Review lead times quarterly.
Institutionalize a supplier lead-time review so replenishment assumptions track operational reality, not memory.
Business Impact
What it delivered.
18%
Holding Cost Reduction
98.5%
Service Level Maintained
40
Optimized SKUs
$2.4M
Working Capital Released
In Retrospect
Lessons learned.
Every project leaves behind a better way of thinking.
- 01
Good inventory decisions begin with demand quality, not larger safety stock.
- 02
Reducing cost required improving assumptions, not reducing service.
- 03
The greatest value of analytics was enabling better business decisions, not simply producing reports.
““The project wasn’t really about inventory. It was about improving decision quality.””
Closing
Inventory wasn’t the problem. Decision quality was.